Correlation Does Not Imply Causation
You may have heard repeatedly that “Correlation does not imply causation.” An amusing example of this comes from a 2012 study that showed a positive correlation (Pearson’s r = 0.79) between the per capita chocolate consumption of a nation and the number of Nobel Prizes awarded to citizens of that nation (Messerli, 2012). It seems clear, however, that this does not mean that eating chocolate causes people to win Nobel Prizes, and it would not make sense to try to increase the number of Nobel Prizes won by recommending that parents feed their children more chocolate.
There are two reasons that correlation does not imply causation. The first is called the directionality problem. Two variables, X and Y, can be statistically related because X causes Y or because Y causes X. Consider, for example, a study showing that whether or not people exercise is statistically related to how happy they are—such that people who exercise are happier on average than people who do not. This statistical relationship is consistent with the idea that exercising causes happiness, but it is also consistent with the idea that happiness causes exercise. Perhaps being happy gives people more energy or leads them to seek opportunities to socialize with others by going to the gym.
The second reason that correlation does not imply causation is called the third-variable problem. Two variables, X and Y, can be statistically related not because X causes Y, or because Y causes X, but because some third variable, Z, causes both X and Y. For example, the fact that nations that have won more Nobel Prizes tend to have higher chocolate consumption probably reflects geography in that European countries tend to have higher rates of per capita chocolate consumption and invest more in education and technology (once again, per capita) than many other countries in the world. Similarly, the statistical relationship between exercise and happiness could mean that some third variable, such as physical health, causes both of the others. Being physically healthy could cause people to exercise and cause them to be happier.
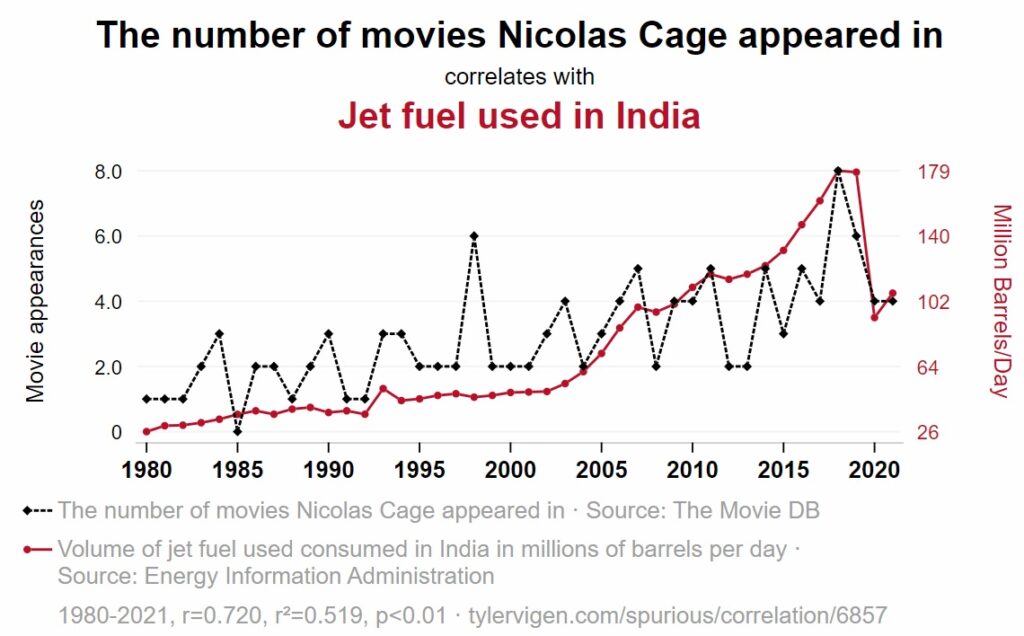
Correlations that are a result of a third-variable are often referred to as spurious correlations. Some excellent and amusing examples of spurious correlations can be found at Tyler Vigen’s website (Figure 7.7 provides one such example).

5G Violence
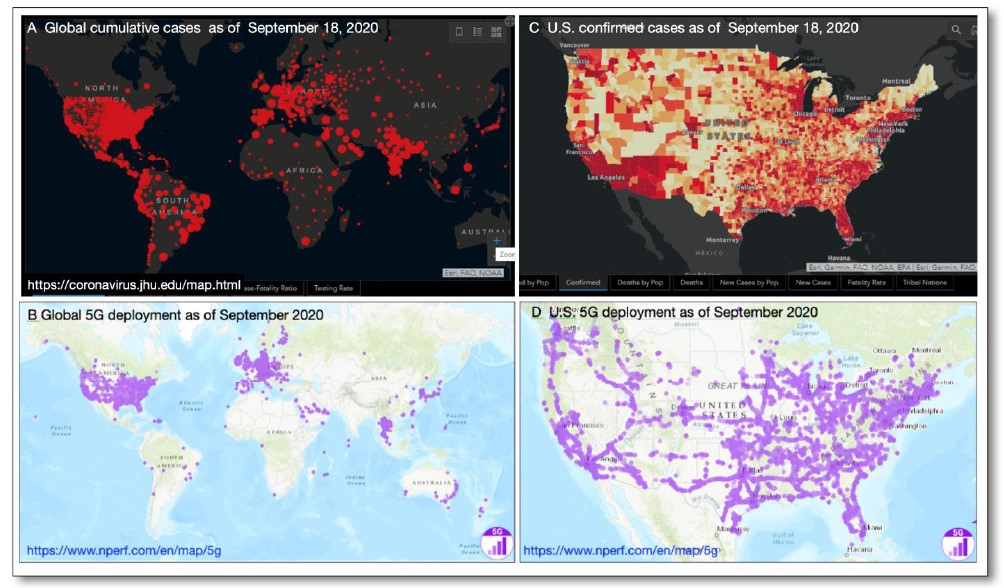
The Covid-19 pandemic was a world-changing event in that it brought the entire world to a standstill for almost 2 years. There was a lot of uncertainty and fear about the origins of the virus as well as numerous conspiracy theories about causes and cures. One common image floating around the internet was similar to what we see in Figure 7.8: the overlap between 5G towers and the prevalence of COVID-19 cases.

As we can see, there is a strong correlation between 5G towers and COVID-19 cases. There was even a bombing in Nashville Tennessee linked to this conspiracy theory. However, what people did not understand was the third variable problem: correlation (however strong) does not mean causation. Is it possible that the distribution of 5G towers and the prevalence of an epidemic are correlation only because they are related to a third variable?

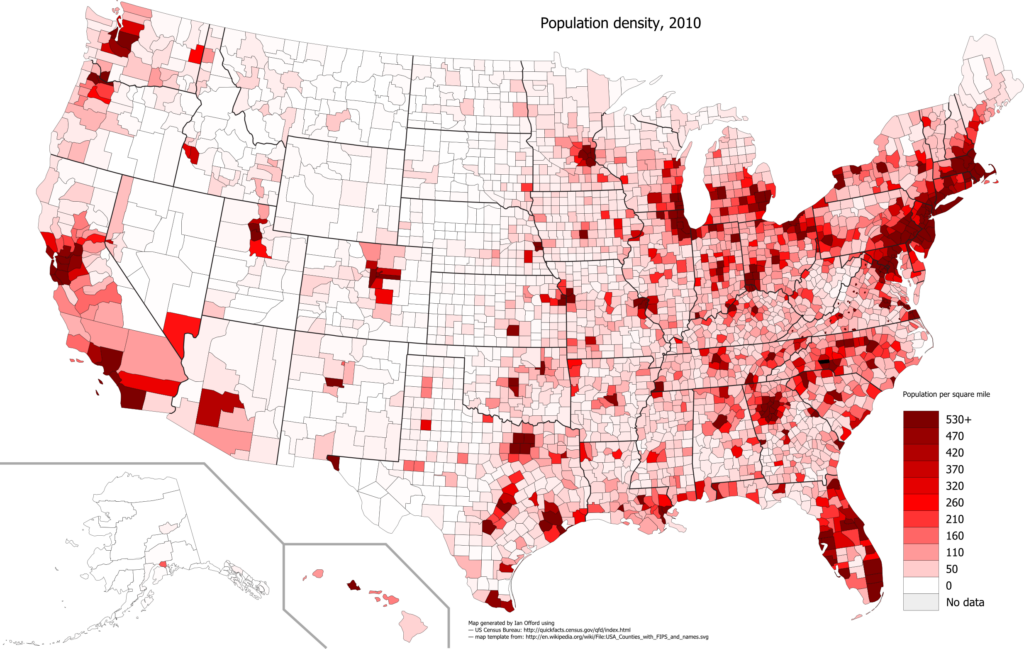
As we can see from Figure 7.9, the population in the continental United States is not equally distributed across the land. Companies build 5G towers where they are needed. Therefore, they tend to build more towers in cities with high population density compared to rural areas. In the same vein, epidemics spread in places where human beings are more densely population and less so in rural areas with lower populations. This third variable (population density) is independently correlated with 5G towers and COVID-19 cases. However, if you just did a correlation between the latter two variables, you will find correlations. However, this does not mean there is a relationship between them.
Media Attributions
- Figure 7.7 “The number of movies Nicolas Cage appeared in correlates with Jet fuel used in India” by Tyler Vigen, via TylerVigen.com, is used under a CC BY 4.0 license.
- Figure 7.8 Tsiang, A. & Havas, M. (2021). COVID-19 Attributed Cases and Deaths are Statistically Higher in States and Counties with 5th Generation Millimeter Wave Wireless Telecommunications in the United States. Medical Research Archives, 9(4). https://doi.org/10.18103/mra.v9i4.2371
- Figure 7.9 “United States Population Density” via Wikimedia Commons, is used under a CC–SA 3.0 license.

